
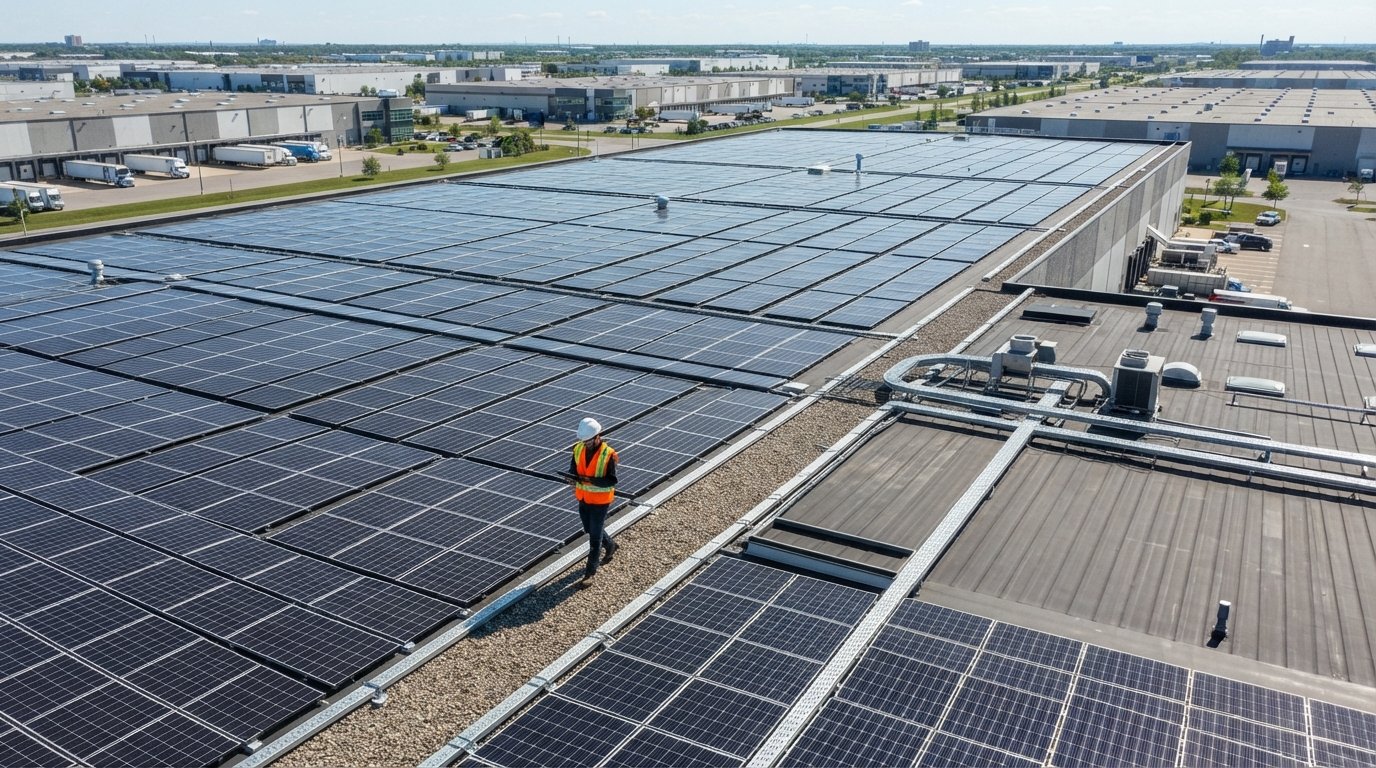
Commercial Solar Panel Efficiency Ratings for Businesses 2026
Commercial solar panel efficiency ratings for businesses 2026 reveal which tiers deliver the strongest ROI. Compare TOPCon, HJT, and PERC panels for your facility.
By Scott Thompson
Learn more about Solar Panel Installation and Repair for guides, costs, and what to expect.
Compare Solar Panel Installation and Repair Pros Near You

Enter your ZIP code to compare top-rated local professionals and request free quotes.
Electricity costs for commercial buildings have climbed steadily since 2022, and utilities in high-demand regions now charge businesses peak rates that can exceed 20 cents per kilowatt-hour. For facility managers and CFOs, the question is no longer whether solar makes financial sense. It is which panels deliver enough output per square foot to justify the investment. Commercial solar panel efficiency ratings for businesses 2026 sit at the center of that decision, and the numbers have shifted meaningfully in the past two years.
Efficiency ratings determine how much power a panel produces relative to its surface area. A warehouse with 40,000 square feet of usable roof has a hard ceiling on installed capacity, and that ceiling rises or falls with panel efficiency. Choosing a 22 percent panel over an 18 percent panel can mean the difference between covering 70 percent of a facility's load and covering 90 percent. Over a 25-year system life, that gap translates into hundreds of thousands of dollars in avoided utility costs.
This guide breaks down what the 2026 efficiency landscape looks like for commercial buyers, which technologies are worth the premium, and how to evaluate quotes without getting lost in spec sheets.
What Panel Efficiency Actually Means for a Commercial Building
Panel efficiency is the percentage of sunlight hitting a panel that gets converted into usable electricity. A 21 percent efficient panel turns 21 percent of incoming solar energy into DC power. The remaining 79 percent is lost as heat or reflected away. Residential buyers often treat efficiency as a nice-to-have. Commercial buyers should treat it as a hard constraint because roof space, structural load limits, and shading patterns create fixed boundaries.
Consider a distribution center in Dallas with 100,000 square feet of roof. After accounting for HVAC units, skylights, walkways, and setback requirements, perhaps 60,000 square feet remain usable. At 18 percent efficiency, that roof supports roughly 1.1 megawatts of capacity. At 22 percent efficiency, the same roof supports about 1.34 megawatts, a 22 percent increase in generating capacity with zero additional real estate. For a facility paying 11 cents per kWh, that extra 240 kilowatts produces roughly $38,000 in additional annual savings in the Dallas area.
Efficiency also affects balance-of-system costs. Higher-efficiency panels mean fewer racks, fewer clamps, less wiring, and fewer labor hours per watt installed. Those savings partially offset the higher per-panel price that premium modules command. The net effect is that the true cost difference between a mid-tier and a high-efficiency panel is often smaller than the sticker price suggests.
Finally, efficiency influences degradation and long-term yield. Panels with higher initial efficiency typically use better cell passivation and encapsulant materials, which slow the rate at which output declines. A panel that loses 0.25 percent per year will retain 94 percent of its original output after 25 years. A cheaper panel losing 0.55 percent per year retains only 86 percent. For a commercial array producing 1.5 million kWh annually, that 8 percent gap equals 120,000 kWh per year by year 25.
2026 Efficiency Tiers: What Counts as Good, Better, and Best
The commercial solar market in 2026 has settled into three broad efficiency tiers. Understanding where a quoted panel falls helps buyers quickly assess whether the price premium is justified.
Tier 1 panels, often labeled standard efficiency, run from 17 to 19.5 percent. These are typically older PERC (Passivated Emitter and Rear Contact) designs or early-generation TOPCon modules. They remain widely available and cost the least per watt. For businesses with abundant unshaded roof space and modest energy loads, Tier 1 panels can deliver excellent returns because the lower upfront cost outweighs the capacity ceiling.
Tier 2 panels, the current commercial sweet spot, range from 20 to 22 percent. Most use TOPCon (Tunnel Oxide Passivated Contact) or advanced PERC architectures. These panels balance cost and output well, and they dominate the quotes that reputable installers present to small and mid-sized businesses. If you are comparing multiple bids, Tier 2 modules are the baseline against which others should be measured.
Tier 3 panels, the highest efficiency commercially available, start at 22.5 percent and reach up to 24 percent for premium monocrystalline designs. These use heterojunction (HJT) or interdigitated back contact (IBC) technology. They cost 15 to 30 percent more per watt than Tier 2 panels but make sense when roof space is tight, structural load limits are strict, or the business wants maximum output from a limited footprint.
Here is a quick reference for how these tiers compare on key commercial metrics:
- Tier 1 (17 to 19.5 percent): Lowest cost per watt, highest space requirements, best for large unshaded roofs with modest load profiles.
- Tier 2 (20 to 22 percent): Balanced cost and output, most common in commercial quotes, suitable for most small and mid-sized businesses.
- Tier 3 (22.5 to 24 percent): Highest output per square foot, premium pricing, ideal for constrained roofs or high-value urban properties.
It is worth noting that efficiency ratings are measured under Standard Test Conditions (STC): 1,000 watts per square meter irradiance, 25 degrees Celsius cell temperature, and AM 1.5 spectrum. Real-world conditions differ. Hot roofs in Arizona can push cell temperatures above 65 degrees Celsius, reducing output by 10 to 15 percent depending on the panel's temperature coefficient. Always check that coefficient alongside the efficiency rating.
TOPCon vs HJT vs PERC: Which Technology Wins for Business Rooftops
The three dominant cell architectures in 2026 each carry distinct tradeoffs for commercial installations. PERC remains the workhorse of the industry. It is mature, widely manufactured, and inexpensive. Its efficiency ceiling sits around 23 percent in laboratory conditions but commercial products typically top out at 21 percent. PERC panels degrade slightly faster than newer technologies and perform less well in high heat.
TOPCon has become the default choice for most commercial projects. It adds a thin oxide layer between the silicon wafer and the metal contact, which reduces electron recombination and boosts efficiency by 1 to 2 percentage points over PERC. TOPCon panels also have better temperature coefficients, typically losing 0.30 to 0.35 percent of output per degree Celsius above 25, compared to 0.35 to 0.40 for PERC. In hot climates like Texas, Arizona, and Florida, that difference matters. A 500 kW TOPCon array in Phoenix may produce 3 to 5 percent more annual energy than an equivalent PERC array.
HJT (heterojunction) technology combines crystalline silicon with thin amorphous silicon layers. It delivers the highest efficiency available in commercial modules and the best temperature performance, often losing only 0.25 percent per degree Celsius. HJT panels also degrade more slowly. The downside is cost and supply. Fewer manufacturers produce HJT at commercial scale, and lead times can stretch to 12 weeks or more. For businesses with tight timelines, TOPCon is usually the safer bet.
When evaluating quotes, ask the installer for the panel's datasheet and check three numbers: efficiency percentage, temperature coefficient, and annual degradation rate. A panel with 21.5 percent efficiency and a 0.30 percent temperature coefficient will often outperform a 22 percent panel with a 0.40 coefficient in real-world conditions. Do not let a single headline number drive the decision.
How Efficiency Ratings Translate to Real Savings: A Commercial Example
Abstract percentages become meaningful when attached to a specific building. Walk through a mid-sized manufacturing facility in Atlanta with a 25,000-square-foot roof and an annual electricity consumption of 600,000 kWh. The facility pays an average of 12 cents per kWh, or $72,000 per year.
After structural and shading analysis, 18,000 square feet of roof is usable. Option A uses Tier 2 panels at 21 percent efficiency. Option B uses Tier 3 panels at 23.5 percent efficiency. Both options use the same inverter and racking, and both receive the 30 percent federal Investment Tax Credit.
Option A installs approximately 315 kW of capacity. At an average of 4.5 peak sun hours per day in Atlanta, the array produces about 517,000 kWh annually, covering 86 percent of the facility's load. At 12 cents per kWh, that saves $62,000 per year.
Option B installs approximately 352 kW of capacity. It produces about 578,000 kWh annually, covering 96 percent of the load and saving $69,400 per year. The Tier 3 system costs roughly $28,000 more upfront. The additional annual savings of $7,400 produce a payback on that incremental cost of under four years. Over a 25-year system life, the Tier 3 choice generates approximately $185,000 more in total savings.
That calculation changes if the roof is larger or the load is smaller. A business with 50,000 square feet of usable roof and a 400,000 kWh annual load does not need Tier 3 panels. Tier 2 modules will cover the load with room to spare, and the premium spent on Tier 3 would be wasted. Efficiency is only valuable when space is constrained or when the business wants to maximize output from a fixed footprint.
If you are unsure which tier fits your facility, working with an experienced commercial installer makes the analysis much easier. Our guide on how to find the best commercial solar company walks through the vetting questions that separate qualified commercial contractors from residential-focused installers who occasionally dabble in business projects.
Reading a Commercial Solar Quote: Efficiency Red Flags and Green Lights
Most commercial solar quotes bury efficiency details in an appendix. Buyers who know what to look for can quickly separate strong proposals from weak ones. Start with the panel model number and pull the manufacturer's datasheet. Verify that the efficiency rating matches what the quote claims. Some installers quote the panel's STC efficiency but install a lower-tier variant with the same model family name.
Next, check the system's overall efficiency, not just the panel's. Inverter efficiency, wiring losses, soiling, and shading all reduce real output. A system with 21 percent panels but a poorly designed string layout may underperform a system with 20 percent panels and an optimized design. Ask for the estimated annual production in kWh and the performance ratio, which should fall between 75 and 85 percent for a well-designed commercial system.
Also examine the degradation warranty. Tier 1 panels typically guarantee 80 to 82 percent output at year 25. Tier 2 and Tier 3 panels often guarantee 85 to 88 percent. That warranty difference has real dollar value. A 6 percent output advantage at year 25 on a 500 kW system equals roughly 45,000 kWh per year, or $5,400 annually at 12 cents per kWh.
Finally, confirm that the quote accounts for the 2026 federal tax credit rules. The Investment Tax Credit remains at 30 percent for commercial solar through 2032, but prevailing wage and apprenticeship requirements must be met to qualify for the full rate. Installers who do not mention these requirements may be leaving money on the table.
For businesses that want to compare equipment options and incentive programs side by side, independent resources like SolarEnergy.ai provide current data on panel performance, state-level rebates, and financing structures that can sharpen the analysis before signing a contract.
Matching Efficiency to Your Business Case
The right efficiency tier depends on three variables: available roof area, electricity consumption, and budget. Businesses with large, unshaded roofs and moderate loads should focus on Tier 2 panels and allocate savings toward battery storage or EV charging infrastructure. Businesses with constrained roofs, high loads, or sustainability mandates that require maximum renewable generation should invest in Tier 3 panels even at a premium.
It also helps to think about future needs. If the business plans to add refrigeration, manufacturing equipment, or a fleet of electric vehicles in the next five years, sizing the solar array for today's load may leave the facility short. Higher-efficiency panels provide headroom for future growth without requiring a second installation.
Commercial solar panel efficiency ratings for businesses 2026 reflect a market that has matured. The gap between mid-tier and premium panels has narrowed in price while widening in performance. Buyers who understand the tiers, check the real-world metrics, and match efficiency to their specific constraints will capture the strongest returns. Those who simply accept the first quote without examining the efficiency details may end up with a system that underproduces for decades.
Take the time to compare at least three quotes, verify every efficiency claim against manufacturer datasheets, and model the 25-year savings for each option. The difference between a good commercial solar investment and a great one often comes down to a single percentage point of efficiency applied to the right roof.