
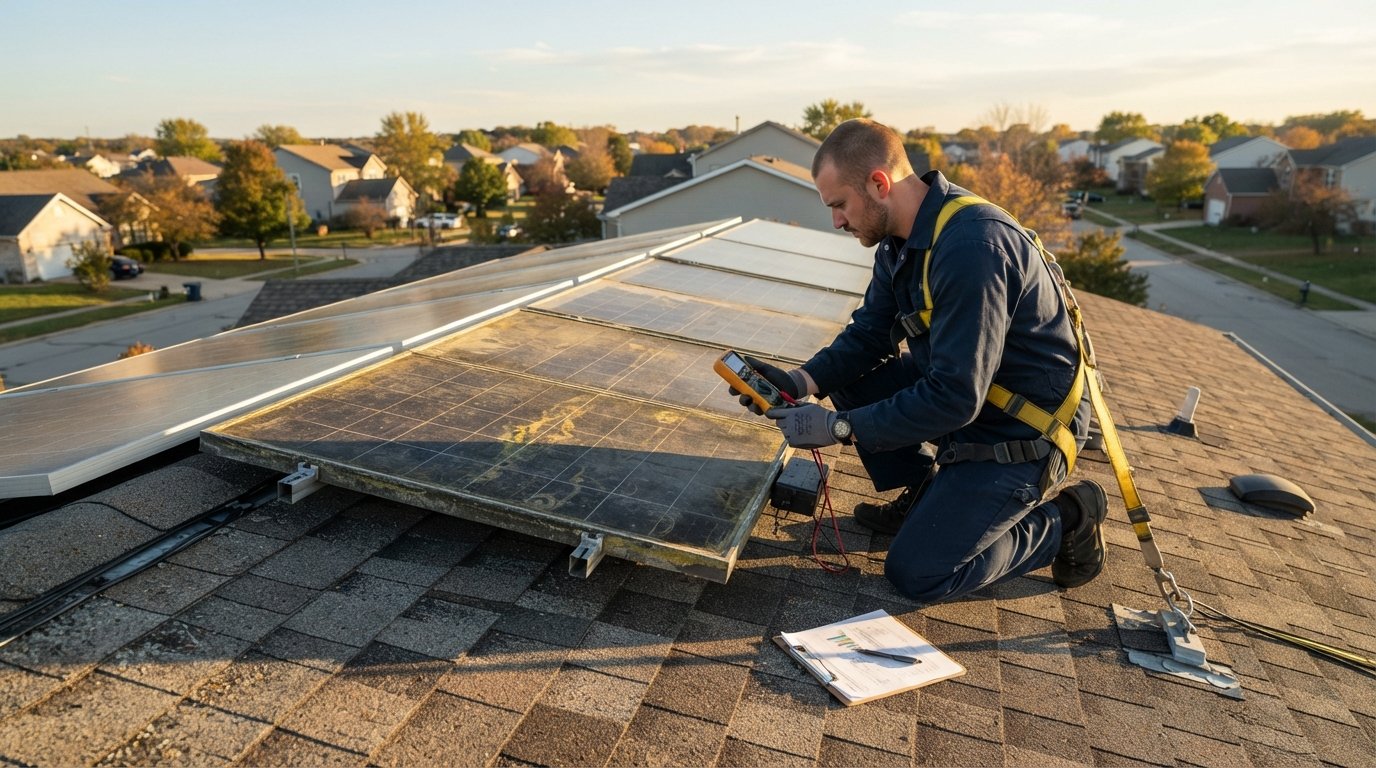
Solar Panel Efficiency Over 25 Years: Real Degradation Data
Solar panel efficiency over 25 years degradation data reveals median losses of just 0.3 to 0.5 percent annually, meaning most panels still produce over 85 percent of their original power after two decades.

By Alexia Mabel
Find Local Pros Near You

Enter your ZIP code to compare top-rated local professionals and request free quotes.
When you invest in a solar energy system, you are making a 25-year bet on the sun. The critical question is not whether panels work on day one, but how much power they will still produce in year 20 or year 25. Solar panel efficiency over 25 years degradation data gives you the answer. Understanding these numbers helps you calculate realistic long-term savings, evaluate warranty claims, and decide whether a system will truly pay for itself. Whether you are comparing quotes or planning a new installation, knowing the actual degradation rates reported by manufacturers and independent researchers puts you in control of your financial outcome.
This article breaks down what the data actually shows, how different technologies perform, and what you can expect from your own system over its lifetime. We will look at real-world studies, manufacturer warranties, and the factors that accelerate or slow down performance loss.
What Solar Panel Degradation Means and Why It Matters
Solar panel degradation is the gradual decline in a panel's ability to convert sunlight into electricity. It is measured as a percentage of the original rated capacity lost per year. A panel that starts at 400 watts and degrades at 0.5 percent per year will produce roughly 380 watts after ten years and about 350 watts after 25 years. This decline is normal, unavoidable, and factored into every reputable manufacturer's warranty.
Why does this matter for your wallet? Because your savings projections depend on production. If you assume zero degradation and the system loses 10 percent of its output over two decades, your actual return on investment will be lower than expected. Conversely, if you understand realistic degradation rates, you can size your system appropriately and set accurate expectations. The difference between a system degrading at 0.3 percent annually versus 0.8 percent annually can mean thousands of dollars in lost or gained electricity over 25 years.
Degradation also affects the environmental case for solar. A system that produces less power over time displaces less fossil fuel, reducing its lifetime carbon offset. Fortunately, modern panels degrade slowly enough that the vast majority of systems remain highly productive well beyond the 25-year mark.
Industry-Standard Degradation Rates: What the Data Shows
For decades, the solar industry has used 0.5 percent annual degradation as a rough benchmark for crystalline silicon panels. That means after 25 years, a panel would retain about 87.5 percent of its original capacity. However, actual field data often shows better performance. Many premium panels now degrade at 0.25 to 0.35 percent per year, retaining over 90 percent of their capacity after 25 years.
Independent research from the National Renewable Energy Laboratory (NREL) and other institutions has tracked thousands of systems. A landmark NREL study found median degradation rates of around 0.5 percent per year for systems installed before 2000, but newer systems consistently show lower rates. The Lawrence Berkeley National Laboratory reported median degradation of 0.4 percent per year for systems installed after 2000. These numbers confirm that the industry standard is conservative, and real-world performance is often better.
Manufacturers translate these rates into warranties. A typical 25-year linear power warranty guarantees that a panel will produce at least 80 to 85 percent of its rated output at year 25. Premium warranties, such as those from SunPower or certain LG models, guarantee 92 percent or higher. These warranties are based on extensive degradation data and serve as a contractual floor for performance.
To put this in perspective, here is a comparison of common degradation rates and their 25-year outcomes:
- 0.25 percent per year: Retains 93.75 percent after 25 years (premium panels).
- 0.35 percent per year: Retains 91.25 percent after 25 years (high-efficiency panels).
- 0.50 percent per year: Retains 87.5 percent after 25 years (standard industry benchmark).
- 0.70 percent per year: Retains 82.5 percent after 25 years (older or lower-tier panels).
- 1.0 percent per year: Retains 75 percent after 25 years (early-generation or defective panels).
As you can see, the difference between the best and worst rates is nearly 19 percentage points over 25 years. That translates directly into energy production and bill savings. Choosing panels with lower degradation rates can significantly improve your long-term return.
Real-World Degradation Data from Long-Term Studies
Laboratory tests and warranties are useful, but real-world data is the ultimate proof. Several long-term studies have monitored solar installations for 20 years or more, providing valuable insights into how panels actually perform in diverse climates.
A comprehensive study by the International Energy Agency (IEA) analyzed over 200 systems across Europe and found an average degradation rate of 0.5 percent per year. However, the study also noted that systems in hot, dry climates degraded slightly faster than those in temperate zones. Another study from the University of Ljubljana in Slovenia tracked a 25-year-old system and found only 0.4 percent annual degradation, with the panels still producing over 90 percent of their original output.
In the United States, the SunShot Initiative funded research that monitored thousands of residential systems. The results showed that median degradation was around 0.3 percent per year for systems installed after 2005. This is significantly better than the 0.5 percent often quoted. The study attributed the improvement to better manufacturing quality, improved encapsulants, and more robust frames.
One notable case is the 25-year-old system at the National Wind Technology Center in Colorado. After a quarter-century of operation, the panels were still producing 85 percent of their rated capacity, implying a degradation rate of about 0.6 percent per year. While this is on the higher end, it is still within warranty expectations.
These studies consistently show that while degradation is real, it is gradual and predictable. The vast majority of panels will comfortably meet or exceed their 25-year warranties.
How Different Panel Technologies Degrade
Not all solar panels are created equal. The degradation rate depends heavily on the semiconductor material, manufacturing quality, and encapsulation. Here is how the major technologies compare based on available data.
Monocrystalline silicon panels are the most common and generally exhibit the lowest degradation rates. High-quality monocrystalline panels from tier-1 manufacturers typically degrade at 0.25 to 0.4 percent per year. Their uniform crystal structure and advanced passivation layers contribute to this stability.
Polycrystalline silicon panels, while slightly less efficient, also degrade slowly. Historically, they degraded at around 0.5 to 0.7 percent per year, but modern poly panels have closed the gap with monocrystalline, often achieving 0.4 to 0.5 percent annual degradation.
Thin-film panels, such as cadmium telluride (CdTe) and copper indium gallium selenide (CIGS), have different degradation profiles. Early thin-film panels degraded faster, sometimes at 1 percent per year or more. However, modern thin-film technology has improved dramatically. First Solar, a leading CdTe manufacturer, guarantees a degradation rate of 0.5 percent per year, with some studies showing even lower rates in certain conditions.
Bifacial panels, which capture light from both sides, are relatively new but show promising degradation data. Because they often use high-quality monocrystalline cells and advanced glass-glass encapsulation, their degradation rates are similar to or better than standard monofacial panels, often around 0.3 to 0.4 percent per year.
When comparing panels, always look at the manufacturer's linear power warranty. It is the most reliable indicator of expected degradation. A 25-year warranty that guarantees 85 percent output implies a degradation rate of 0.6 percent per year, while a 92 percent guarantee implies about 0.32 percent per year.
Factors That Accelerate or Slow Degradation
While the average degradation rate is predictable, several factors can influence how quickly a specific system loses efficiency. Understanding these can help you maximize your system's longevity.
Temperature is one of the biggest factors. High heat accelerates the chemical and physical processes that degrade solar cells. Systems installed in hot climates like Arizona or Texas may degrade slightly faster than those in cooler regions. Proper mounting and ventilation can help mitigate heat buildup.
Humidity and moisture intrusion can also speed degradation. If moisture penetrates the panel's encapsulant, it can corrode metal contacts and cause delamination. High-quality panels with robust seals and glass-glass construction resist moisture better. Coastal areas with salt spray require panels with enhanced corrosion resistance.
Mechanical stress from wind, snow, and hail can cause microcracks that expand over time. While panels are designed to withstand extreme weather, repeated stress can lead to hot spots and reduced output. Installing panels with reinforced frames and using proper mounting techniques helps prevent this.
Finally, the quality of the inverter and balance of system components matters. While not part of the panel itself, inverter inefficiency or failure can reduce overall system output. Choosing a reputable inverter brand and maintaining it properly ensures you get the most from your panels.
On the positive side, regular cleaning and maintenance can slow degradation. Dust, pollen, and bird droppings block sunlight and cause hot spots. Keeping panels clean helps maintain efficiency and prevents long-term damage. For a deeper dive into how efficiency ratings impact your savings, see our guide on what is solar panel efficiency rating.
What This Means for Your 25-Year Savings
Now that you understand degradation, let us translate it into real money. Suppose you install a 10 kW system that produces 15,000 kWh in year one. Your utility charges 15 cents per kWh, so you save $2,250 in the first year. With a 0.5 percent annual degradation rate, your production declines slightly each year.
Over 25 years, the total energy produced is the sum of annual production after degradation. Using a 0.5 percent rate, the system would produce about 352,000 kWh over 25 years. At a constant 15 cents per kWh, that is $52,800 in savings. If the degradation rate were 0.25 percent, the total would be about 361,000 kWh, or $54,150 in savings. That is a difference of $1,350 over the system's life. While not massive, it is significant, and it grows if electricity prices rise.
It is also important to note that most panels do not stop working at year 25. They continue to produce power, just at a lower rate. Many systems remain operational for 30 to 40 years, providing additional savings beyond the warranty period. The degradation curve is gradual, so you will never wake up one day to a dead system.
When evaluating quotes, ask installers for the panel's linear power warranty and degradation rate. Compare the 25-year guaranteed output. A panel that guarantees 92 percent is worth more than one that guarantees 80 percent, all else being equal. This is where NewSolarQuotes can help. By connecting you with certified installers who offer transparent performance data, you can make an informed choice. For more information on solar energy and to explore your options, visit SolarEnergy.ai, a comprehensive resource for solar information and industry insights.
How to Verify Degradation and Protect Your Investment
Once your system is installed, you can monitor its performance to ensure it is degrading as expected. Most modern inverters come with monitoring apps that show real-time and historical production. Compare your actual output to the expected output based on the degradation curve.
If you notice a sudden drop or a performance level below the warranty threshold, contact your installer. The manufacturer's warranty covers degradation beyond the specified rate. Keep records of your monitoring data and any maintenance performed.
To maximize your system's lifespan, follow these best practices:
- Schedule professional inspections every 3 to 5 years to check for hot spots, microcracks, and loose connections.
- Clean panels annually or as needed, especially in dusty or pollen-heavy areas.
- Trim trees that may shade panels, as shading can cause disproportionate losses and stress on cells.
- Ensure proper ventilation behind panels to reduce heat buildup.
- Consider adding a battery or upgrading your inverter if you want to maximize self-consumption of the power you produce.
By staying proactive, you can ensure your system delivers the expected savings for decades. The data on solar panel efficiency over 25 years degradation shows that with quality equipment and proper care, your investment will pay off.
In summary, solar panels are a long-term asset that degrades slowly and predictably. The best panels lose only 0.25 to 0.35 percent of their capacity per year, retaining over 90 percent after 25 years. Even standard panels retain 85 percent or more. This means your savings projections are reliable, and your system will continue to generate clean energy for many years beyond the warranty. When you are ready to explore solar for your home or business, use a trusted resource like NewSolarQuotes to compare quotes from certified installers and find the best system for your needs.