Solar System Monitoring: How to Track Production
Learn how to track your solar system's production in real time, spot issues early, and maximize your energy savings with practical monitoring tips.

By Andy Pearson
Learn more about Solar Panel Installation and Repair for guides, costs, and what to expect.
Compare Solar Panel Installation and Repair Pros Near You
Enter your ZIP code to compare top-rated local professionals and request free quotes.
Your solar panels are generating power every day, but are you truly aware of how much electricity they produce? Without a clear view of your system's performance, you could be losing money and energy without knowing it. Solar system monitoring bridges that gap, offering real-time data that helps you maximize your investment. In this guide, we'll explore solar system monitoring how to track production to ensure your panels operate at peak efficiency.
Why Monitoring Your Solar System Matters
Monitoring your solar energy system is more than just a nice-to-have feature; it's an essential tool for protecting your investment. When you have eyes on your system's output, you can quickly detect issues such as a failing inverter, dirty panels, or unexpected shading. This early detection can prevent small problems from becoming costly repairs and ensures your system continues to deliver the financial and environmental benefits you expect.
Moreover, monitoring empowers you with data. You can see exactly how much power you generate versus how much you consume, which can help you adjust your energy habits to save even more. For instance, if you notice your system produces excess energy during the day, you might schedule high-energy tasks like laundry or EV charging to those sunny hours. This level of insight transforms your solar setup from a passive asset into an active tool for energy management.
Understanding Solar System Monitoring: The Basics
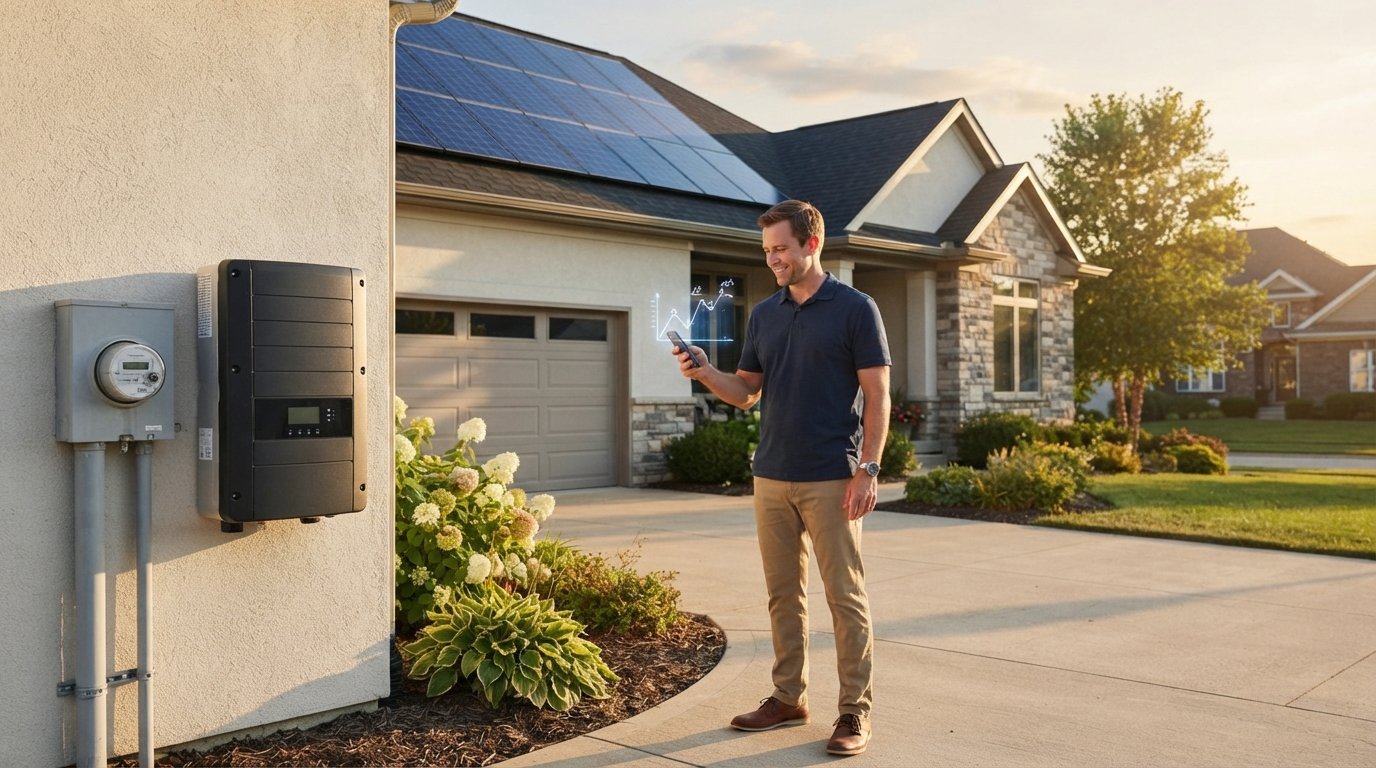
Solar system monitoring involves tracking the performance of your photovoltaic (PV) system in real time. This is typically achieved through a combination of hardware and software. The hardware includes sensors and communication devices that collect data from your inverter and sometimes individual panels. The software, often a web-based dashboard or mobile app, interprets this data and presents it in an easy-to-understand format.
Most modern solar systems come with some form of monitoring from the manufacturer. However, the depth and quality of this monitoring can vary. Some systems only show overall energy production, while others offer panel-level data, alerts for anomalies, and detailed analytics. Understanding what your system offers is the first step in maximizing its benefits. If your system lacks robust monitoring, or if you're looking for more advanced features, there are third-party solutions available that can integrate with most inverters.
Key Metrics to Track
To get the most out of your monitoring, focus on these essential metrics that indicate your system's health and efficiency:
- Energy Production (kWh): This is the total amount of electricity your system has generated over a specific period. Comparing daily, monthly, or yearly production against expected values helps spot trends and anomalies.
- System Efficiency: This measures how effectively your solar panels convert sunlight into electricity. A sudden drop in efficiency may signal soiling, shading, or equipment issues.
- Inverter Status: Your inverter is the brain of your system, converting DC to AC power. Monitoring its status alerts you to faults or grid disconnections.
- Performance Ratio (PR): This is a standardized measure that accounts for environmental factors like temperature and irradiance. A PR close to the expected value (usually 75-85%) indicates a healthy system.
By regularly reviewing these metrics, you can gain a comprehensive understanding of your system's performance. For instance, if you see that production is consistently lower on certain days, you can investigate whether it's due to weather, temporary shading, or a developing issue that needs professional attention.
How to Track Production: Software and Tools
Tracking your solar production effectively hinges on the tools you use. Most solar manufacturers offer their own monitoring platforms, such as Enphase Enlighten, SolarEdge monitoring, or Tesla app. These are excellent because they're tailored to your equipment and often provide seamless integration with your inverter. They generally offer a user-friendly interface that shows real-time data, historical trends, and even weather-integrated forecasts.
If your system uses a mix of components or you want a more aggregated view, third-party platforms like Sense, Solar Analytics, or the utility-grade monitoring from companies like SolarEnergy.ai can be valuable. These tools often provide deeper analytics, cross-vendor compatibility, and advanced features like AI-based anomaly detection. When choosing a monitoring solution, consider its ease of use, the granularity of data it provides, and whether it offers proactive alerts. A good platform should make it effortless to check your system's health at a glance.
Step-by-Step Guide to Monitoring Your Solar System
To start tracking your production effectively, follow this simple process:
- Set Up Your Monitoring Account: If you haven't already, create an account on your manufacturer's monitoring portal or app. You'll typically need your system's serial number or ID, which can be found on your inverter or in your installation paperwork.
- Connect Your System: Ensure your inverter is connected to your home's Wi-Fi or ethernet network, as this is how data is transmitted to the cloud. Follow the manufacturer's instructions to complete the connection.
- Establish a Baseline: Let your system run for a few weeks to collect data. This will help you understand what normal production looks like for your location, roof, and time of year.
- Check Regularly: Make it a habit to glance at your production dashboard at least weekly. Look for unexpected drops or errors, and review your daily, weekly, and monthly reports.
- Set Up Alerts: Configure notifications so you're immediately informed if your system goes offline or if production deviates significantly from the norm. Most platforms allow you to customize alert thresholds.
Following these steps ensures you're not just collecting data, but actively using it to maintain system health. For example, if you receive an alert about low production, you can check the dashboard to see if the issue is localized to a specific string of panels or the entire system, then decide whether to clean your panels or call a technician.
Interpreting Your Production Data
Raw numbers are only useful if you can understand what they mean. Your monitoring dashboard will show a graph of production over time, usually shaped like a bell curve that peaks at solar noon. By comparing this curve to your expected output, you can identify problems. For example, a sudden drop in the middle of a sunny day could indicate a passing cloud, but if it's persistent, it might point to a shading issue from a new tree branch or a malfunctioning panel.
Your system's performance ratio is another critical metric. It's calculated by dividing your actual energy yield by the theoretical maximum based on your panel's capacity and local solar irradiance. A PR consistently below 75% may indicate a systemic problem, such as excessive soiling or underperforming equipment. Over time, you can also compare your production to similar systems in your area, which many monitoring platforms now allow, to benchmark your performance.
Common Monitoring Issues and How to Resolve Them
Even with the best monitoring tools, you may encounter issues. Connectivity problems are common, often due to Wi-Fi drops or inverter network settings. If your monitoring portal shows no data, check your internet connection and the inverter's status lights. On the other hand, if you see data but it's clearly wrong, such as production at night, it could be a sensor error or a CT clamp that's installed incorrectly.
It's also important to understand that not every change in production is a problem. Seasonal variations, weather patterns, and even the angle of the sun all affect output. Monitoring helps you differentiate between these normal fluctuations and actual faults. When you do spot a genuine issue, your monitoring data becomes a powerful diagnostic tool when you contact your installer, as you can provide them with precise information about the problem, speeding up the resolution process.
Maximizing Your Solar Investment Through Data
Ultimately, solar system monitoring is about getting the most from your investment. By tracking production, you can ensure your system is always performing as expected, which directly impacts your savings. For instance, if you notice that your panels are underperforming due to dust buildup, a simple cleaning can restore efficiency and save you hundreds of dollars annually. Similarly, if you spot an inverter fault early, you can have it repaired under warranty before it leads to extended downtime.
Monitoring also supports your long-term energy strategy. The data you collect can help you decide if a battery is a worthwhile addition, or if you should adjust your energy consumption patterns. When you understand your production and consumption curves, you can make informed decisions that enhance your energy independence. To learn more about how solar system sizes affect your monitoring and production, check out our detailed guide on why solar system sizes vary and the key factors explained. By staying engaged with your system's data, you're not just a passive solar owner; you're an active participant in your energy future.
In summary, solar system monitoring is an indispensable tool for any solar owner. It turns your panels into a transparent, manageable asset, providing peace of mind and tangible financial benefits. By understanding how to track production and leveraging the data, you ensure that your investment continues to pay off for years to come. So, take the time to explore your monitoring platform, understand your metrics, and make data-driven decisions. Your solar system will thank you with optimal performance and maximum savings.