
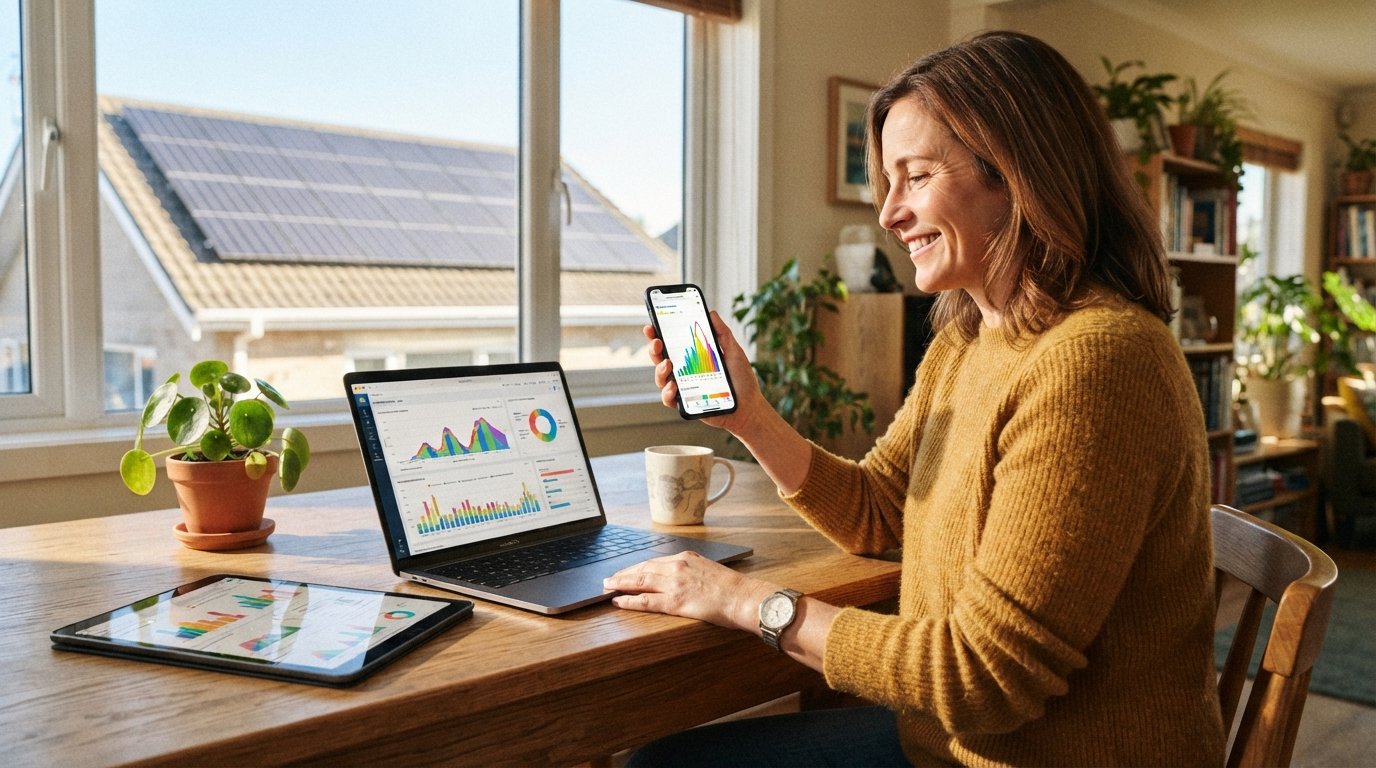
Solar System Performance Monitoring Apps Compared
Compare top solar monitoring apps for production tracking and fault alerts. Call (833)-212-3715 for expert help choosing the right system.

By Wendy Keller
Learn more about Solar Panel Installation and Repair for guides, costs, and what to expect.
Compare Solar Panel Installation and Repair Pros Near You
Enter your ZIP code to compare top-rated local professionals and request free quotes.
Your solar panels are producing electricity, but are they producing enough? Without performance monitoring, a failing inverter, a shaded panel, or a wiring issue can quietly drain hundreds of dollars from your annual savings. The right monitoring app turns raw production data into actionable insight, helping you spot underperformance before it becomes a costly repair. With dozens of options available, from manufacturer-branded tools to third-party analytics platforms, choosing the best solar monitoring app for your system requires understanding what each one does well and where it falls short. This comparison breaks down the leading solar system performance monitoring apps compared across key criteria: data granularity, alerting, export capability, and integration with broader home energy dashboards, so you can select the tool that matches your goals and your system hardware.
Manufacturer Apps Versus Third-Party Monitoring Platforms
The first decision most system owners face is whether to stick with the app provided by their inverter or panel manufacturer or to adopt an independent monitoring platform. Manufacturer apps, such as Enphase Enlighten, SolarEdge Monitoring, and SMA Sunny Portal, come preconfigured with your system. They connect directly to the inverter or microinverter gateway and typically offer reliable, real-time production data with minimal setup. Because these apps are tied to the hardware, they also serve as the primary channel for firmware updates and warranty-related diagnostics. However, manufacturer apps vary widely in quality. Some offer robust analytics and export tools, while others provide only basic production graphs and limited historical data.
Third-party monitoring platforms, including Solar-Log, AlsoEnergy (now part of Stem), and open-source solutions like Home Assistant with solar integrations, aim to fill the gaps. They can aggregate data from multiple inverter brands, normalize performance metrics, and provide advanced analytics such as performance ratio calculations and irradiance-adjusted comparisons. The trade-off is complexity: third-party platforms often require additional hardware (data loggers or gateways) and may involve subscription fees. For homeowners with a single-brand system, the manufacturer app is usually sufficient. For those with mixed hardware, multiple arrays, or a desire for deeper analytics, a third-party platform can be worth the investment.
When comparing solar system performance monitoring apps, consider the following factors:
- Hardware compatibility: Does the app support your inverter brand and model? Some third-party platforms support only certain manufacturers.
- Data refresh rate: Manufacturer apps often update every 5 to 15 minutes; third-party loggers may poll less frequently.
- Cost structure: Free with hardware versus subscription-based versus one-time purchase.
- Alerting and notifications: Customizable thresholds versus fixed alerts.
- Data export and API access: Essential for warranty claims and integration with home energy systems.
For most homeowners, starting with the manufacturer app is the path of least resistance. If you later find it lacking in analytics or export flexibility, you can add a third-party monitoring layer without replacing your existing hardware. If you are still in the planning phase and want to ensure your system is sized correctly for monitoring and savings goals, our guide on solar for small homes: system sizing guide for savings explains how to right-size your array so that performance data is meaningful from day one.
Metrics Worth Tracking Daily Versus Monthly
Not all solar metrics deserve equal attention. Daily monitoring should focus on immediate production and system health, while monthly reviews should assess trends, savings, and overall performance against expectations. Understanding which metrics to check on which cadence prevents data overload and helps you catch issues early.
On a daily basis, the most valuable metrics are current power output (in watts or kilowatts), energy produced today (in kilowatt-hours), and system status indicators (online, offline, fault codes). A sudden drop to zero during daylight hours usually signals an inverter shutdown or communication loss. A gradual decline over several days could indicate soiling, shading, or a failing panel. Most manufacturer apps display these metrics prominently on their dashboard, often with color-coded status icons. Set up push notifications for system faults and for production falling below a threshold you define, such as 20 percent below the previous week's average for the same time of day.
Monthly reviews should shift to cumulative and comparative metrics: total energy produced, performance ratio (actual production divided by theoretical production based on irradiance), self-consumption rate, and estimated savings. The performance ratio is particularly useful because it normalizes for weather variations; a ratio below 0.75 for a well-designed system often warrants investigation. Monthly reviews are also the right time to export data for your records, especially if you are tracking towards a warranty claim or evaluating whether to add battery storage. For a deeper dive into how system size affects savings and monitoring baselines, refer to our sizing guide linked above.
Here is a simple framework for daily and monthly monitoring:
- Daily check (2 minutes): Open the app, confirm system is online, review today's production curve for anomalies, and check for any active alerts.
- Weekly check (5 minutes): Compare current week's production to the previous week and to the same week last year if available. Note any persistent dips.
- Monthly review (15 minutes): Export production data, calculate performance ratio, review savings against utility bills, and inspect for soiling or shading changes.
This cadence balances vigilance with practicality. Daily checks catch acute failures quickly, while monthly reviews provide the context needed to distinguish normal seasonal variation from genuine underperformance.
Spotting Underperformance Against a Modeled Baseline
The most powerful feature of a good monitoring app is its ability to compare actual production against a modeled baseline, which is the expected output for your specific system given local weather, orientation, tilt, and equipment specifications. Without a baseline, a production number is just a number; with a baseline, you can quantify exactly how much energy (and money) you are losing.
Manufacturer apps often include a basic baseline derived from system size and a generic insolation model, but these can be inaccurate if your installation differs from standard assumptions. Third-party platforms and some advanced manufacturer tools allow you to import a custom baseline from design software like Aurora Solar or PVsyst. If your installer provided a production estimate, that document is your baseline. Enter it into your monitoring app if the app supports custom baselines, or keep it handy for manual comparison. Over time, you can calculate a rolling performance ratio and flag months where actual production falls more than 10 percent below the modeled estimate.
Common causes of underperformance include:
- Soiling: Dust, pollen, or bird droppings reducing irradiance reaching the panels.
- Shading: New tree growth or new construction casting shadows.
- Equipment degradation: Inverter efficiency loss or panel degradation beyond normal rates.
- Wiring or connection issues: Loose connectors or ground faults causing voltage drops.
- Communication faults: Data gaps that mimic underproduction but are actually monitoring failures.
When you detect sustained underperformance, the first step is to rule out monitoring errors (check that the app is receiving data from all optimizers or microinverters). If data is complete and production is genuinely low, schedule a professional inspection. Many monitoring apps allow you to annotate events (such as a scheduled cleaning or a known shading event) so that future analysis can account for them. For homeowners preparing to move and wanting to transfer monitoring responsibilities, resources like Moving.Homes relocation guides offer checklists for handing over solar system documentation and app access to new owners.
Data Access and Export for Warranty Claims
Solar equipment warranties typically cover defects in materials and workmanship for 10 to 25 years, but claims require evidence. Monitoring data is that evidence. A warranty claim for a failed inverter or underperforming panel is far stronger when you can present a clear timeline of production data showing the exact date performance degraded. Unfortunately, not all monitoring apps make data export easy. Some manufacturer apps restrict export to a summary CSV, while others provide full-resolution time-series data via an API or a web portal.
When evaluating solar system performance monitoring apps compared for warranty readiness, look for the following capabilities:
- Bulk export: Ability to export at least one year of daily or hourly data in a common format (CSV, Excel).
- API access: Programmatic access to raw data, useful for creating your own archives or integrating with third-party tools.
- Data retention policy: How long does the app store historical data? Some free tiers retain only 12 months; paid tiers may retain 5 years or more.
- Report generation: Built-in PDF reports that summarize performance and can be attached to warranty claims.
A practical strategy is to export your data monthly and store it in a personal cloud folder. This creates an independent archive that survives even if you change monitoring platforms or the manufacturer discontinues its app. If you ever need to file a warranty claim, you will have a complete, timestamped record. Additionally, some third-party monitoring platforms offer warranty assistance services, helping you package data and communicate with manufacturers. While these services add cost, they can be valuable for large or complex systems.
Integrating Monitoring with Home Energy Dashboards
Solar production is only one piece of your home's energy picture. To maximize savings, you need to see how solar generation aligns with consumption, battery state of charge, and grid import/export. Home energy dashboards, such as Span Panel, Sense, Emporia Vue, and open-source Home Assistant, can integrate solar monitoring data to provide a unified view. The ease of integration depends on your monitoring app's willingness to share data.
Manufacturer apps with open APIs (Enphase and SolarEdge both offer APIs, though with rate limits and authentication requirements) can feed data into Home Assistant or other dashboards. Third-party platforms often provide MQTT or Modbus outputs for local integration. If you are considering a battery or already have one, check whether your monitoring app displays battery state of charge and grid interaction alongside solar production; some do, some require a separate app. For a holistic view, aim for a dashboard that shows at least: instantaneous solar production, home consumption, grid import/export, and battery charge/discharge (if applicable). This allows you to shift heavy loads (like EV charging or laundry) to times when solar production is high, increasing self-consumption and reducing payback time.
Integration also future-proofs your monitoring. If you later add an EV charger or a heat pump, a unified dashboard helps you understand the impact on your solar savings. Before committing to a monitoring app, verify that it supports the integration path you want. Some apps lock data behind proprietary cloud services, making local integration difficult or impossible. Prioritize apps that offer local API access or at least a documented cloud API with reasonable rate limits.
Making the Right Choice for Your System
Choosing a solar performance monitoring app is not about finding the one with the most features; it is about matching the app's strengths to your system hardware, your monitoring habits, and your long-term goals. For most homeowners with a single-brand system, the manufacturer app provides a solid foundation, especially if it offers data export and API access. If you have mixed hardware, multiple arrays, or a desire for advanced analytics and warranty support, a third-party platform is worth the additional cost and setup effort.
As you compare solar system performance monitoring apps, keep the following priorities in mind: reliable data with frequent refresh, customizable alerts for faults and underperformance, easy data export for your records, and compatibility with home energy dashboards. If you are still planning your solar installation, choose equipment that comes with a robust monitoring ecosystem from the start. And remember that monitoring is an ongoing practice, not a one-time setup; a few minutes each week can protect your investment and maximize your returns for decades. For personalized guidance on system design and installer selection, NewSolarQuotes connects you with certified professionals who can recommend monitoring solutions tailored to your home.